The Momentum Reversal Indicator (MRI)
Origins of the indicator
It all starts in 1980 when the original publication SEQUENTIAL «The Third Element of Thrust Dynamics» by Larry Williams was taught to the late Tyler Jenks of Lucid Investments.

Over the last few decades, Tone Vays has designed his own indicator which is based on time momentum rather than only the asset price. His friendship & collaboration with Tyler Jenks and 10+ years of trading experience with Tom DeMark’s TD Sequential eventually led to the creation of the Momentum Reversal Indicator (MRI).


It’s all about timing
The MRI enables a unique way of looking at markets because it relies more on time than price to identify exhaustion in a trend. This enables you to better judge the current state of a trend and anticipate potential trend reversals. The indicator can also identify areas where trends are ready to potentially extend into new highs or lows. Ultimately the MRI can make it easier to buy bottoms and sell tops.
The MRI is a powerful indicator that can be used on any timeframe and for any asset class.
See ahead with MRI SIGNALS
The platform offers you a macro view about the trend direction of assets. The overview shows you all assets that are near a topping or bottoming point and enables you to quickly assess which ones are worth trading immediately or at a later point in time.
Benefit from the features in MRI SIGNALS to never miss a move in the markets and quickly identify potential tops or bottoms for a broad range of assets.

Case studies
Examples where the MRI was spot on.
Examples where the MRI was spot on.
Tops in

MONTHLY
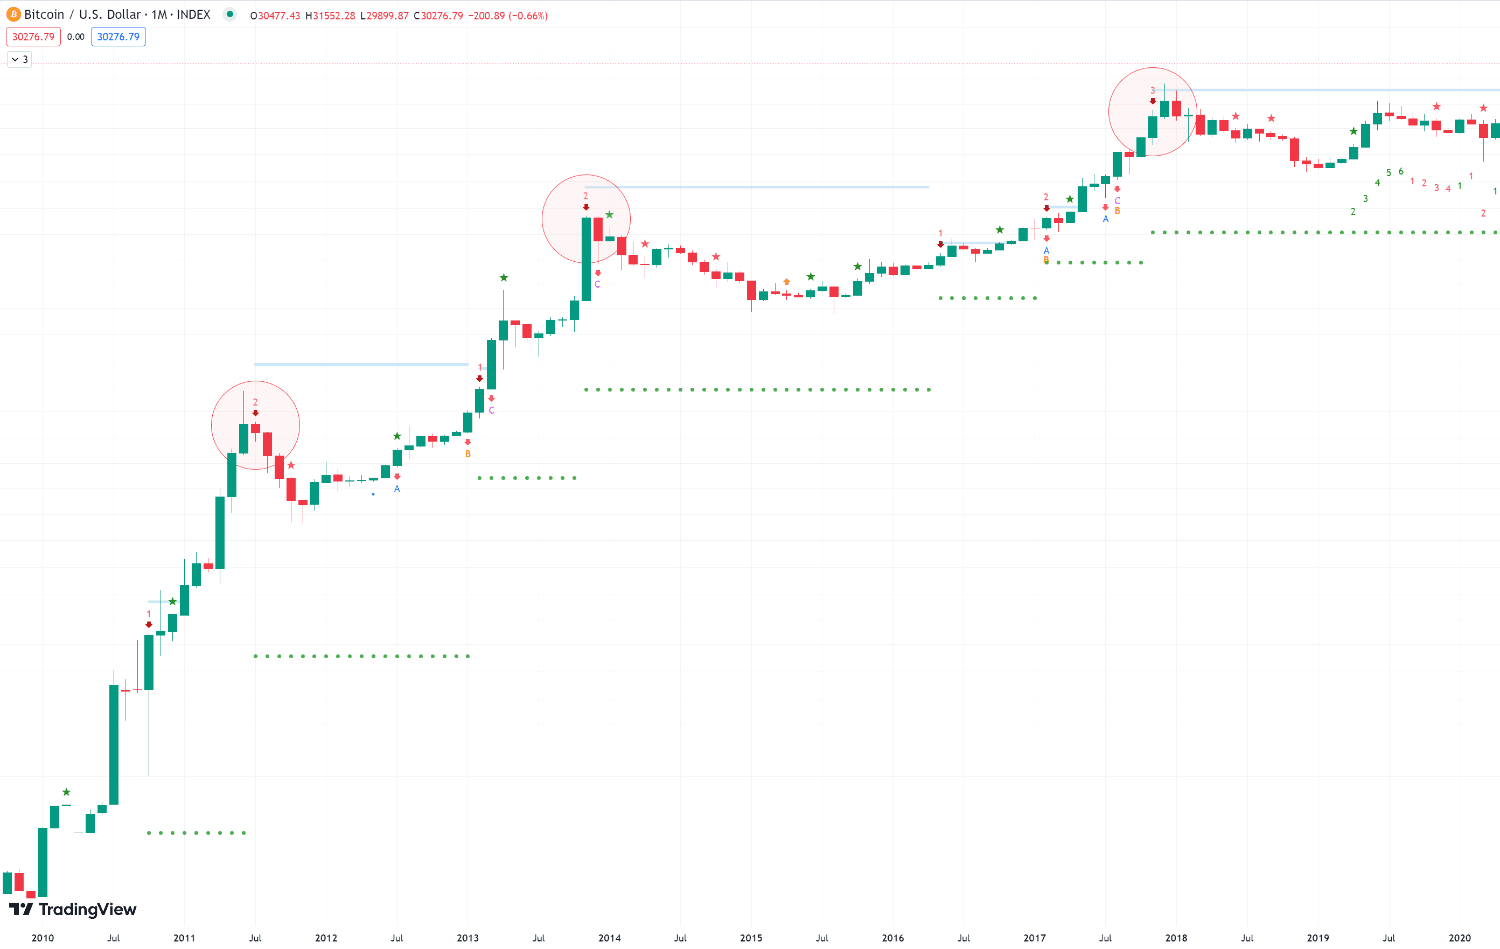
The time based algorithm of the MRI perfectly signaled two of the cycle tops in BTC from 2011 - 2014. The cycle top of the 2017 bull market was signalled one candle early but the price also clearly never closed above the blue acceleration line.
Top & Bottom in

MONTHLY
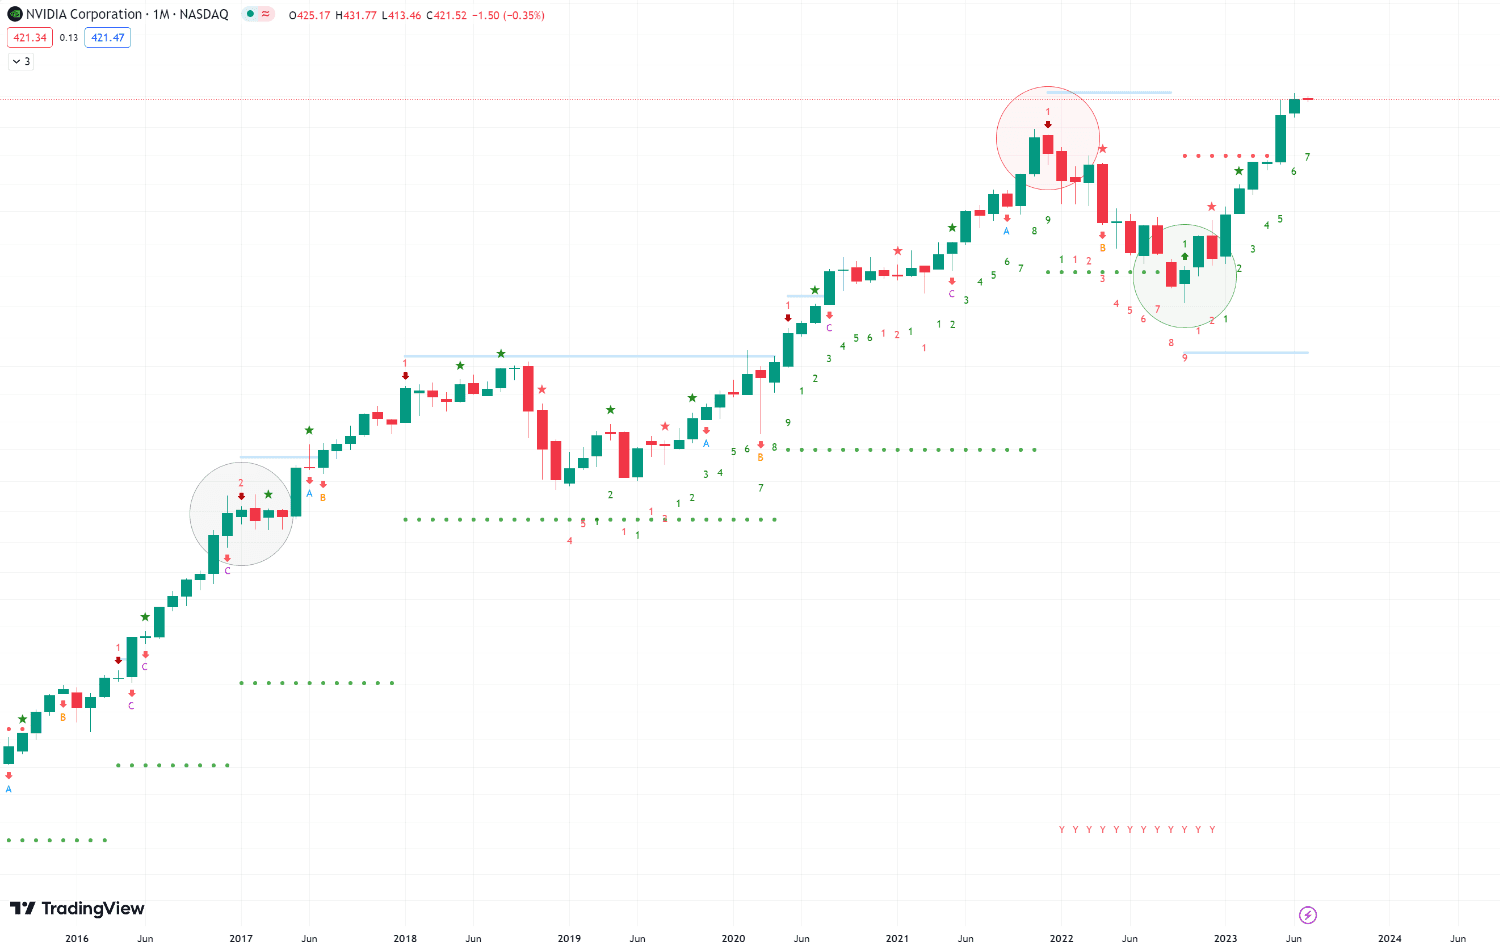
The MRI beautifully signaled the top and bottom signal on Nvidia. The MRI signal in 2017 didn't immediately lead to upside, rather the price consolidated for 1-4 candles. A common pattern that can be observed in many assets.
Tops & Bottoms in

MONTHLY
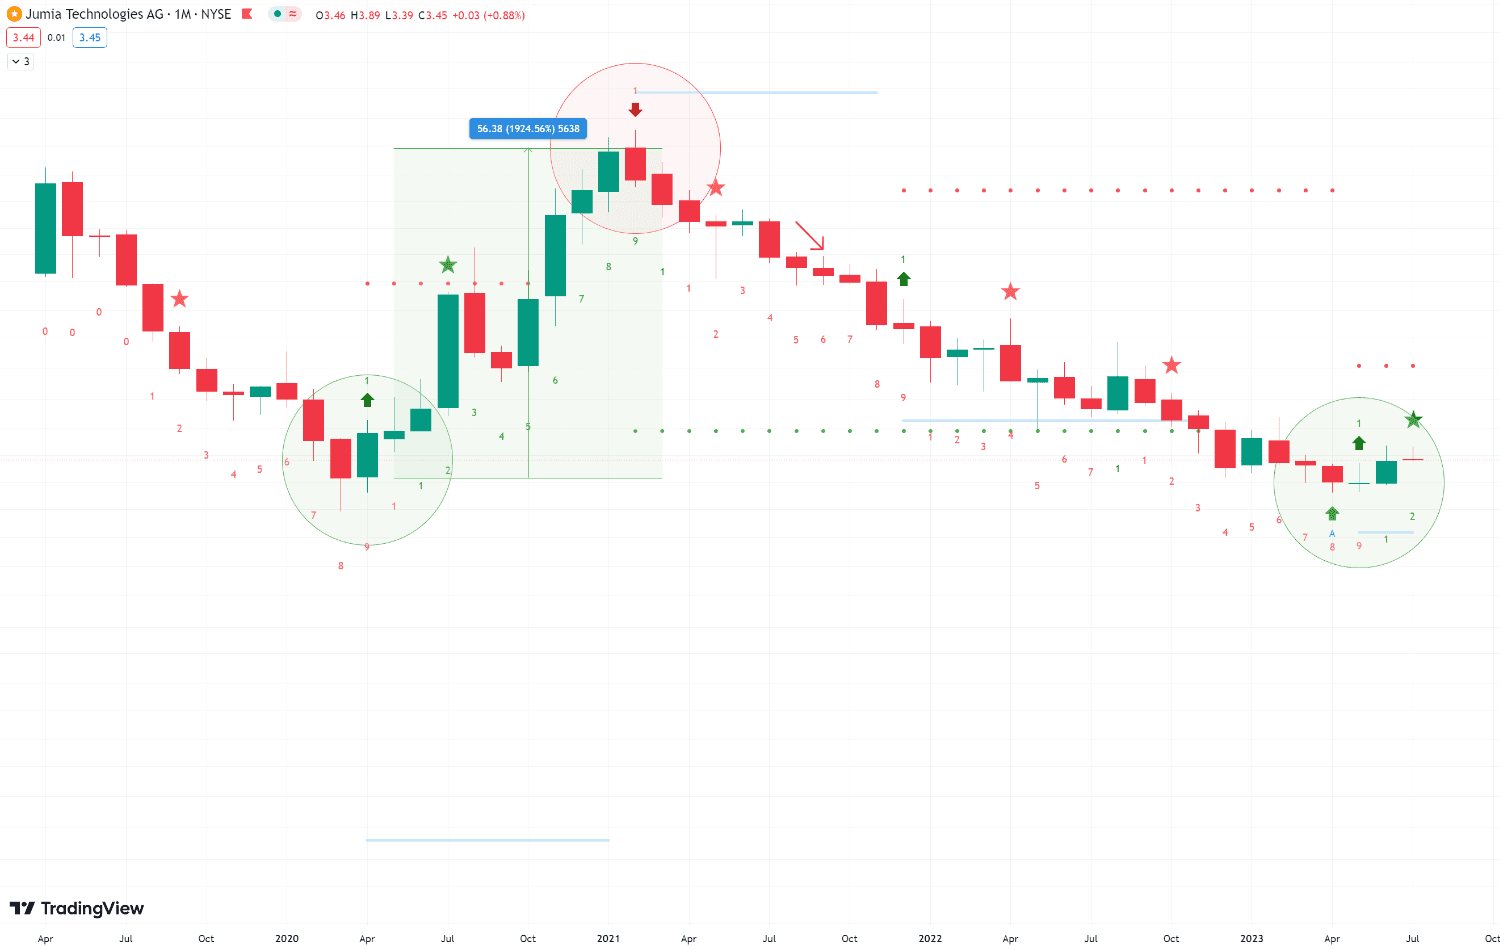
A beautiful bottom signal that was followed by almost 2000% of upside! The MRI then perfectly signaled the top which led the price to go back to its previous low.
Tops & Bottoms in USD/HUF
WEEKLY
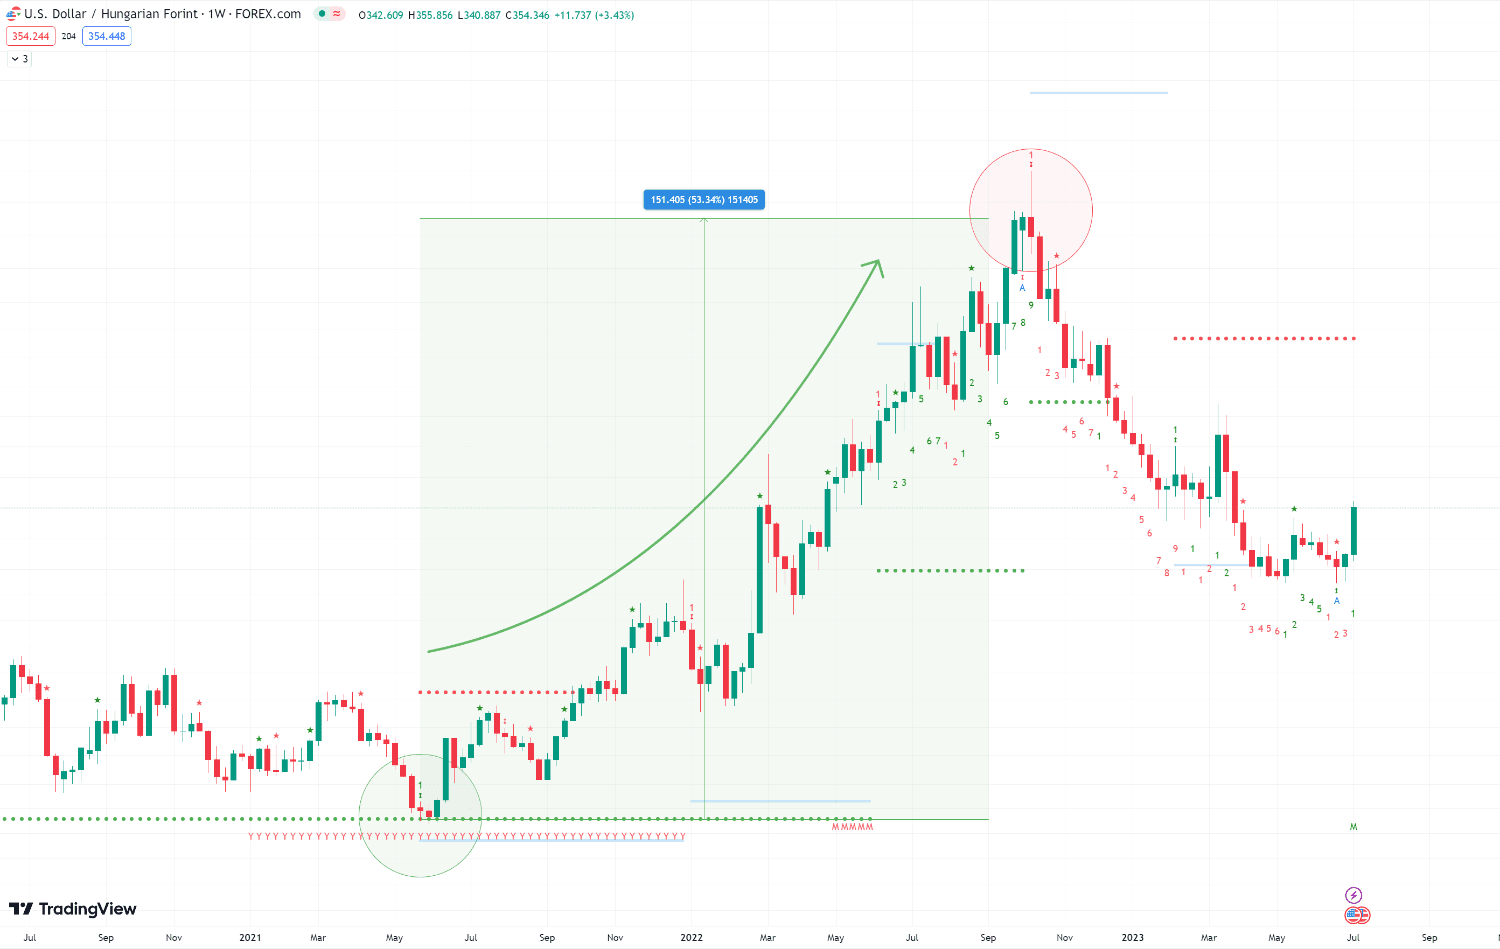
The signals occured on the weekly timeframe and the bottom signal even happened inside of a yearly MRI bottom signal. What followed were months of upside with a 53% increase in the currency against the dollar.
Tops in
MONTHLY
The time based algorithm of the MRI perfectly signaled two of the cycle tops in BTC from 2011 - 2014. The cycle top of the 2017 bull market was signalled one candle early but the price also clearly never closed above the blue acceleration line.
Top & Bottom in
MONTHLY
The MRI beautifully signaled the top and bottom signal on Nvidia. The MRI signal in 2017 didn't immediately lead to upside, rather the price consolidated for 1-4 candles. A common pattern that can be observed in many assets.
Tops & Bottoms in
MONTHLY
A beautiful bottom signal that was followed by almost 2000% of upside! The MRI then perfectly signaled the top which led the price to go back to its previous low.
Tops & Bottoms in USD/HUF
WEEKLY
The signals occured on the weekly timeframe and the bottom signal even happened inside of a yearly MRI bottom signal. What followed were months of upside with a 53% increase in the currency against the dollar.
Tops in
MONTHLY
The time based algorithm of the MRI perfectly signaled two of the cycle tops in BTC from 2011 - 2014. The cycle top of the 2017 bull market was signalled one candle early but the price also clearly never closed above the blue acceleration line.
Top & Bottom in
MONTHLY
The MRI beautifully signaled the top and bottom signal on Nvidia. The MRI signal in 2017 didn't immediately lead to upside, rather the price consolidated for 1-4 candles. A common pattern that can be observed in many assets.
Tops & Bottoms in
MONTHLY
A beautiful bottom signal that was followed by almost 2000% of upside! The MRI then perfectly signaled the top which led the price to go back to its previous low.
Tops & Bottoms in USD/HUF
WEEKLY
The signals occured on the weekly timeframe and the bottom signal even happened inside of a yearly MRI bottom signal. What followed were months of upside with a 53% increase in the currency against the dollar.
Tops in
MONTHLY
The time based algorithm of the MRI perfectly signaled two of the cycle tops in BTC from 2011 - 2014. The cycle top of the 2017 bull market was signalled one candle early but the price also clearly never closed above the blue acceleration line.
Top & Bottom in
MONTHLY
The MRI beautifully signaled the top and bottom signal on Nvidia. The MRI signal in 2017 didn't immediately lead to upside, rather the price consolidated for 1-4 candles. A common pattern that can be observed in many assets.
Tops & Bottoms in
MONTHLY
A beautiful bottom signal that was followed by almost 2000% of upside! The MRI then perfectly signaled the top which led the price to go back to its previous low.
Tops & Bottoms in USD/HUF
WEEKLY
The signals occured on the weekly timeframe and the bottom signal even happened inside of a yearly MRI bottom signal. What followed were months of upside with a 53% increase in the currency against the dollar.
Tops in

MONTHLY
The time based algorithm of the MRI perfectly signaled two of the cycle tops in BTC from 2011 - 2014. The cycle top of the 2017 bull market was signalled one candle early but the price also clearly never closed above the blue acceleration line.

Top & Bottom in

MONTHLY
The MRI beautifully signaled the top and bottom signal on Nvidia. The MRI signal in 2017 didn't immediately lead to upside, rather the price consolidated for 1-4 candles. A common pattern that can be observed in many assets.

Tops & Bottoms in

MONTHLY
A beautiful bottom signal that was followed by almost 2000% of upside! The MRI then perfectly signaled the top which led the price to go back to its previous low.

Tops & Bottoms in USD/HUF
WEEKLY
The signals occured on the weekly timeframe and the bottom signal even happened inside of a yearly MRI bottom signal. What followed were months of upside with a 53% increase in the currency against the dollar.

Tops in
MONTHLY
The time based algorithm of the MRI perfectly signaled two of the cycle tops in BTC from 2011 - 2014. The cycle top of the 2017 bull market was signalled one candle early but the price also clearly never closed above the blue acceleration line.
Top & Bottom in
MONTHLY
The MRI beautifully signaled the top and bottom signal on Nvidia. The MRI signal in 2017 didn't immediately lead to upside, rather the price consolidated for 1-4 candles. A common pattern that can be observed in many assets.
Tops & Bottoms in
MONTHLY
A beautiful bottom signal that was followed by almost 2000% of upside! The MRI then perfectly signaled the top which led the price to go back to its previous low.
Tops & Bottoms in USD/HUF
WEEKLY
The signals occured on the weekly timeframe and the bottom signal even happened inside of a yearly MRI bottom signal. What followed were months of upside with a 53% increase in the currency against the dollar.
Tops in
MONTHLY
The time based algorithm of the MRI perfectly signaled two of the cycle tops in BTC from 2011 - 2014. The cycle top of the 2017 bull market was signalled one candle early but the price also clearly never closed above the blue acceleration line.
Top & Bottom in
MONTHLY
The MRI beautifully signaled the top and bottom signal on Nvidia. The MRI signal in 2017 didn't immediately lead to upside, rather the price consolidated for 1-4 candles. A common pattern that can be observed in many assets.
Tops & Bottoms in
MONTHLY
A beautiful bottom signal that was followed by almost 2000% of upside! The MRI then perfectly signaled the top which led the price to go back to its previous low.
Tops & Bottoms in USD/HUF
WEEKLY
The signals occured on the weekly timeframe and the bottom signal even happened inside of a yearly MRI bottom signal. What followed were months of upside with a 53% increase in the currency against the dollar.
Tops in
MONTHLY
The time based algorithm of the MRI perfectly signaled two of the cycle tops in BTC from 2011 - 2014. The cycle top of the 2017 bull market was signalled one candle early but the price also clearly never closed above the blue acceleration line.
Top & Bottom in
MONTHLY
The MRI beautifully signaled the top and bottom signal on Nvidia. The MRI signal in 2017 didn't immediately lead to upside, rather the price consolidated for 1-4 candles. A common pattern that can be observed in many assets.
Tops & Bottoms in
MONTHLY
A beautiful bottom signal that was followed by almost 2000% of upside! The MRI then perfectly signaled the top which led the price to go back to its previous low.
Tops & Bottoms in USD/HUF
WEEKLY
The signals occured on the weekly timeframe and the bottom signal even happened inside of a yearly MRI bottom signal. What followed were months of upside with a 53% increase in the currency against the dollar.
Tops in

MONTHLY
The time based algorithm of the MRI perfectly signaled two of the cycle tops in BTC from 2011 - 2014. The cycle top of the 2017 bull market was signalled one candle early but the price also clearly never closed above the blue acceleration line.

Top & Bottom in

MONTHLY
The MRI beautifully signaled the top and bottom signal on Nvidia. The MRI signal in 2017 didn't immediately lead to upside, rather the price consolidated for 1-4 candles. A common pattern that can be observed in many assets.

Tops & Bottoms in

MONTHLY
A beautiful bottom signal that was followed by almost 2000% of upside! The MRI then perfectly signaled the top which led the price to go back to its previous low.

Tops & Bottoms in USD/HUF
WEEKLY
The signals occured on the weekly timeframe and the bottom signal even happened inside of a yearly MRI bottom signal. What followed were months of upside with a 53% increase in the currency against the dollar.

Tops in
MONTHLY
The time based algorithm of the MRI perfectly signaled two of the cycle tops in BTC from 2011 - 2014. The cycle top of the 2017 bull market was signalled one candle early but the price also clearly never closed above the blue acceleration line.
Top & Bottom in
MONTHLY
The MRI beautifully signaled the top and bottom signal on Nvidia. The MRI signal in 2017 didn't immediately lead to upside, rather the price consolidated for 1-4 candles. A common pattern that can be observed in many assets.
Tops & Bottoms in
MONTHLY
A beautiful bottom signal that was followed by almost 2000% of upside! The MRI then perfectly signaled the top which led the price to go back to its previous low.
Tops & Bottoms in USD/HUF
WEEKLY
The signals occured on the weekly timeframe and the bottom signal even happened inside of a yearly MRI bottom signal. What followed were months of upside with a 53% increase in the currency against the dollar.
Tops in
MONTHLY
The time based algorithm of the MRI perfectly signaled two of the cycle tops in BTC from 2011 - 2014. The cycle top of the 2017 bull market was signalled one candle early but the price also clearly never closed above the blue acceleration line.
Top & Bottom in
MONTHLY
The MRI beautifully signaled the top and bottom signal on Nvidia. The MRI signal in 2017 didn't immediately lead to upside, rather the price consolidated for 1-4 candles. A common pattern that can be observed in many assets.
Tops & Bottoms in
MONTHLY
A beautiful bottom signal that was followed by almost 2000% of upside! The MRI then perfectly signaled the top which led the price to go back to its previous low.
Tops & Bottoms in USD/HUF
WEEKLY
The signals occured on the weekly timeframe and the bottom signal even happened inside of a yearly MRI bottom signal. What followed were months of upside with a 53% increase in the currency against the dollar.
Tops in
MONTHLY
The time based algorithm of the MRI perfectly signaled two of the cycle tops in BTC from 2011 - 2014. The cycle top of the 2017 bull market was signalled one candle early but the price also clearly never closed above the blue acceleration line.
Top & Bottom in
MONTHLY
The MRI beautifully signaled the top and bottom signal on Nvidia. The MRI signal in 2017 didn't immediately lead to upside, rather the price consolidated for 1-4 candles. A common pattern that can be observed in many assets.
Tops & Bottoms in
MONTHLY
A beautiful bottom signal that was followed by almost 2000% of upside! The MRI then perfectly signaled the top which led the price to go back to its previous low.
Tops & Bottoms in USD/HUF
WEEKLY
The signals occured on the weekly timeframe and the bottom signal even happened inside of a yearly MRI bottom signal. What followed were months of upside with a 53% increase in the currency against the dollar.
Disclaimer
These examples were handpicked by us. When using TradingMRI you will find many more examples of the indicator signaling tops & bottoms with accuracy.
Sign up & time the market
Sign up & time the market
© 2023 MRI - Price and Condition Alerting. All Rights Reserved.
© 2023 MRI - Price and Condition Alerting
All Rights Reserved